Contents
- Visits are counted, but people are what a program is for
- A participation figure means little until it is set against the neighbourhood
- Observation counts the people who never sign up
- People who never come have reasons, and they rarely give them unasked
- Counts should change the program, not decorate the report
Look at the annual report of almost any sports center, parks service or community program and you will find recreation participation reported as one large, cheerful figure: total visits for the year, usually higher than last year, often printed in a big font on the first page. It is a real number and someone worked hard to collect it. It is also very nearly the least useful way of describing who takes part.
Recreation participation, in a sense that helps anyone plan, means how many different people in a given population take part in organized or informal recreation, how often, in what, and, just as important, who in that population does not take part at all. A visit count answers none of those questions on its own. It tells you how busy the doors were, not how many lives the program reached, and it says nothing whatsoever about the people who never came through the doors.
Visits are counted, but people are what a program is for
The difference between visits and people sounds technical until you put two cases side by side. A swimming pool that records a large number of visits a year might be serving a broad slice of its neighbourhood, a few visits each. Or it might be serving a loyal group of regulars who come almost every morning, while most of the people living nearby have never been inside. On the annual report both pools look exactly the same.
I don’t say this to belittle the regulars. A group that comes five times a week has found something that matters to them, and keeping them is an achievement. But a service judged only by visits will always drift towards them, because regulars are the cheapest way to raise the figure. Programs get scheduled at the hours they prefer, the activities they like get more space, and newcomers find a place that feels, without anyone intending it, like someone else’s club.
Counting people rather than visits is not difficult with today’s booking and membership systems, and even a paper register can do it if names or initials are kept. The figures worth knowing are simple: how many different people took part in a season, how many came once and never returned, how many stayed through to the end, and how many were new this year. Those four numbers say more about a program than the total ever will, and they fit comfortably next to the other KPIs any manager is already asked to report.
The drop-out figure is the one I would look at first. People who came once and did not return are the closest thing a program has to honest feedback. They were interested enough to try, and something, the hour, the instructor, the atmosphere, the price, the bus, made them stop.
A participation figure means little until it is set against the neighbourhood
A count of participants becomes useful only when it has a denominator: the people it was meant to reach. A youth program with two hundred regular members sounds healthy. If it serves a district with a few hundred teenagers, it is reaching a large share of them. If it serves a district with many thousands, it is reaching a small group, and probably a particular one.
The second step is to compare the profile of participants with the profile of the population around them: age, gender, disability, where people live, roughly how much they earn. That comparison is usually where the surprises turn up. Research on park use that relies on direct observation keeps finding the same pattern. A review of studies using the SOPARC observation method found that parks typically had more male than female visitors and that older adults were seen less than other age groups. None of that shows up in a visit total, and all of it matters for planning.
A participation figure only means something when it is set against the people who live within reach of the program and never appear in it.
The wider health picture, from physical activity to the research on green space and health, gives this some weight. The World Health Organization reports that 31 percent of adults and 80 percent of adolescents do not meet the recommended levels of physical activity. Recreation is not the only answer to that, and I distrust anyone who sells it as a cure. But if the people a program reaches are mostly those who were already active, it is adding comfort to the comfortable rather than changing anything for the people who most need it. That is a question about whom the service is for, and it belongs right beside the larger argument about why recreation matters at all.
Observation counts the people who never sign up
Registration records only see organized activity. A large share of recreation happens without any form being filled in: the evening walk, the pick-up football game, the family picnic, the retired pair who take the same seat every afternoon, the teenagers practising on the steps by the library. These leisure activities are often the main use of a park or a square, and a participation report built only from bookings leaves them out completely.
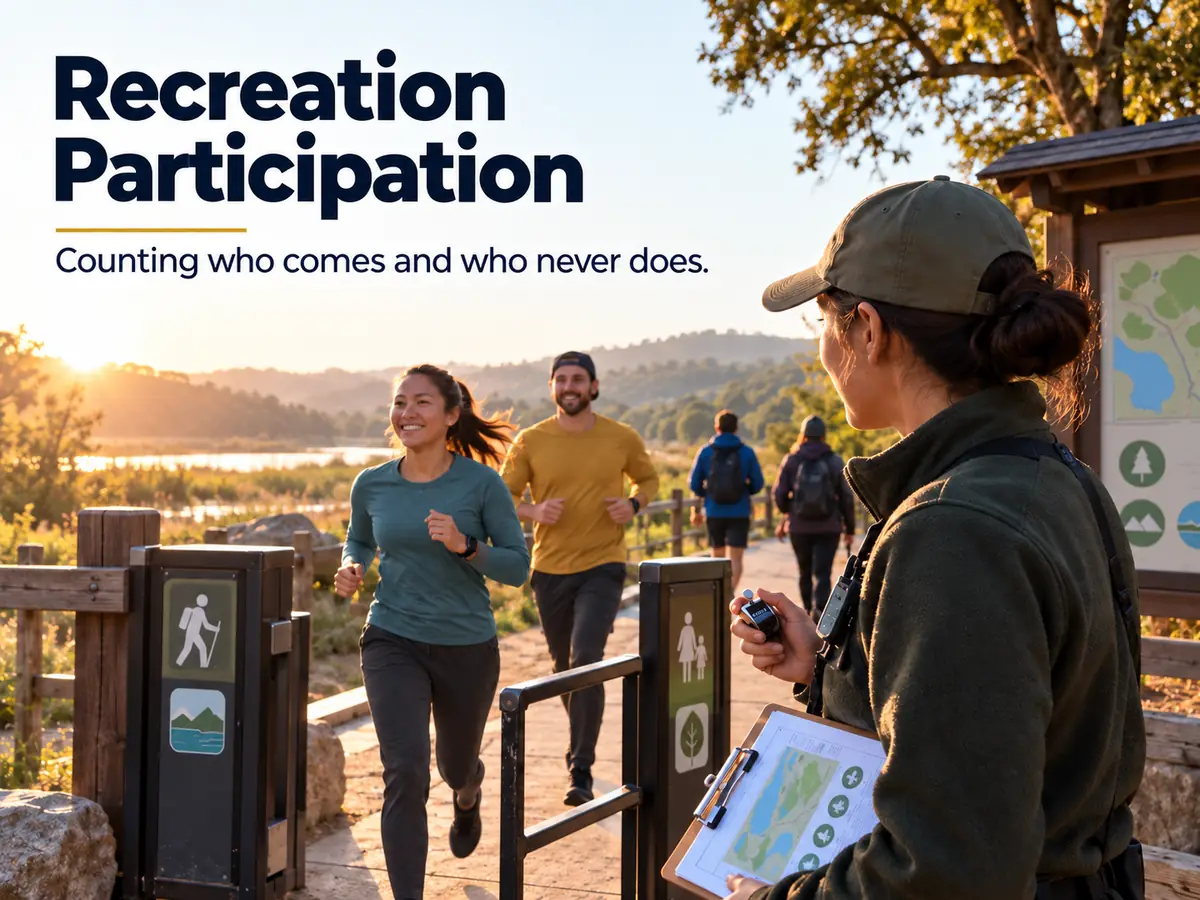
SOPARC was designed for exactly this. Observers divide a park into areas and, at set times, make a quick scan of each area, noting how many people are there, roughly their age and gender, and whether they are sitting, walking or being very active. Repeated across days and seasons, those scans build a picture of who uses which part of the space, at which hours. It is not a perfect tool, and it needs some training to keep the counts consistent. But it captures the informal majority that registration systems never will.
A simpler version works for most places. A member of staff, a caretaker or a partner organization walks a fixed route through the space at a few set times a week and notes how many people are in each area and what kind of people they are. It takes a few minutes. Over a season it shows which corner of the urban park is busy with children and empty of everyone else, which path nobody uses after dark, and which group appears on weekdays but disappears at weekends. Those patterns are often the first sign of a barrier nobody had noticed.
People who never come have reasons, and they rarely give them unasked
Leisure research has long distinguished between people who are not interested in an activity and people who would take part if something were not in the way. The second group is large, and its reasons are usually practical rather than mysterious: no time at the hours offered, looking after small children or an ageing parent, cost, transport, safety on the way home, not having the right clothes or equipment, not knowing anyone, or a quiet sense that the place is not meant for people like them.
Those reasons will not reach you through a satisfaction survey handed out at the end of a session, because the people who hold them were not at the session. This is the blind spot in most participation research done by the services themselves. They ask the people who came, they hear that the people who came are mostly satisfied, and they conclude that the program works.
Reaching non-participants, in a recreation needs assessment or in ordinary program work, means going to where they already are. A short conversation at a school gate, a stand at the weekly market, a few questions added to a household survey, a talk with a health center or a residents’ association, a visit to the workplaces nearby where shift workers might never see a program leaflet. The survey questions themselves can be very plain: what do you do with your free time, what would you like to do that you don’t, what stops you. Asked in the right place, those three questions usually produce more useful planning material than a whole season of feedback forms.
It also helps to be honest about the answers. Sometimes a person simply prefers to stay home, and staying in is a fine choice for an evening. The aim is not to bring everyone in. It is to make sure that people who would come, if the hour, the price or the welcome were different, are not kept away by something the program could change, and that is what inclusive recreation asks of a service day to day.
Counts should change the program, not decorate the report
Participation figures earn their keep only when they lead to decisions. A season of drop-out numbers that shows most newcomers leaving after the second session is a reason to look at what happens in those first sessions. An observation round that never finds older women in the park is a reason to ask them what would bring them, and perhaps to try a walking group, the simplest kind of recreation for older adults, at the hour they suggest. A denominator that shows one district far behind the others is a reason to move some program hours there, even if the visit total dips for a year as a result.
That last point is where the reporting habit becomes a real obstacle. If a service is praised every year for higher total visits, it has every incentive to keep serving its regulars and none to try something slower and harder in the neighbourhood that rarely comes. I would much rather see a report that says plainly: visits fell slightly, but the number of different people taking part rose, and a district that had almost no participants last year now has a regular group. That is a better year, even if the big number on the first page looks worse.
The same logic applies far beyond sports facility management. Discussions about what makes cities livable now often turn to whether residents can find a worthwhile use for their free hours close to home, and participation data, collected honestly, is one of the few ways a city can answer that question with evidence rather than impressions. For anyone working in recreation management, that data is also the strongest argument available when budgets are discussed, provided it shows reach and not only volume.
Start with the people who came once and never returned.